Spot electricity price and the cheapest time to heat the sauna
Home Assistant shows the real spot price with VAT and margin every 15 minutes and finds the cheapest window for the sauna, laundry or any flexible load.
- Published
- Level
- Intermediate
- Hardware
- HomeWizard P1 Meter (optional)
With a spot price contract the price changes every 15 minutes, and the number Nord Pool publishes is not what you pay: VAT and your retailer’s margin come on top. This setup turns the Nord Pool feed into the price you actually pay, says in plain words whether now is a cheap or an expensive moment, and finds the cheapest continuous window of a given length for something you can schedule yourself.
I use two windows: one hour for the sauna somewhere between 18 and 21, and two hours for laundry between 8 and 20. Each window is one instance of a small template blueprint, so adding another one for the dishwasher or charging takes a few lines.
What it does
- Shows the real price. Nord Pool price plus VAT plus margin, in cents per kWh, for now and for the next 15 minutes.
- Tells you if now is a good time. The price is compared with the average of the next 24 hours: cheap, normal or expensive, with the difference in percent.
- Finds the cheapest window. The cheapest continuous run of, say, 60 minutes between an earliest start and a latest end. It shows today’s window, and once today’s range is over it moves on to tomorrow.
- Says what waiting saves. How much cheaper per kWh the window is than starting the same run right now.
- Keeps the whole price curve. All 15-minute prices from midnight onwards, including tomorrow once published, in one sensor attribute for charts and automations.
- Feeds the Energy dashboard. A price sensor in EUR/kWh, so Home Assistant’s own Energy view shows costs at your real price.
- Settings live on the dashboard. Margin, VAT and the window’s length and time range are number helpers, so there is no YAML to edit after setup.
What you need
- A spot price electricity contract and Home Assistant’s built-in Nord Pool integration.
- No extra hardware for the prices. To see what you actually spend, a reader on your smart meter’s HAN port. I use a HomeWizard P1 Meter (step 6).
Step 1: the Nord Pool integration
Go to Settings → Devices & services → Add integration, pick Nord Pool, and choose your area and currency. The package below assumes area FI and EUR, which gives entities such as sensor.nord_pool_fi_current_price. For another area, change fi and FI in the package to match.
Step 2: the cheapest window blueprint
The cheapest window is a template blueprint: it turns a price curve and three settings into one sensor. Save it as config/blueprints/template/automate_the_north/cheapest_window.yaml.
Import blueprint to Home Assistant(opens in a new tab)View on GitHub(opens in a new tab)
Show the blueprint
blueprint:  name: Cheapest electricity window  author: Automate the North  description: >    A sensor with the start of the cheapest continuous window of electricity, for    example for the sauna, laundry or charging. The window has a fixed length and    must fit between an earliest start and a latest end time.

    The sensor shows the whole day's best window, even after it has passed, and    moves on to tomorrow once the latest end time is over. Attributes: end,    average_price, saving (how much cheaper per kWh than starting a run of the same    length now), periods, day (today/tomorrow) and status (upcoming/active/past).

    Needs a price curve sensor with a `prices` attribute: a list of    `{ts: epoch seconds, p: price}` items in 15-minute steps, as made by the    Automate the North spot price package.  source_url: https://github.com/automate-the-north/home-assistant/blob/main/blueprints/template/automate_the_north/cheapest_window.yaml  domain: template  input:    prices:      name: Price curve sensor      description: A sensor with a `prices` attribute (list of `ts` and `p`).      selector:        entity:          filter:            - domain: sensor    minutes:      name: Window length      description: An input_number with the length of the window in minutes.      selector:        entity:          filter:            - domain: input_number    earliest:      name: Earliest start      description: An input_number with the earliest start hour (0–23).      selector:        entity:          filter:            - domain: input_number    latest:      name: Latest end      description: An input_number with the latest end hour (1–24).      selector:        entity:          filter:            - domain: input_number
# Recalculated every 15 minutes, after a restart or template reload, when prices change and when you change a settingtriggers:  - trigger: homeassistant    event: start  # Recalculate right after a template reload too, not only on the next quarter  - trigger: event    event_type: event_template_reloaded  - trigger: time_pattern    minutes: /15  - trigger: state    entity_id:      - !input prices      - !input minutes      - !input earliest      - !input latest
actions:  - variables:      prices_entity: !input prices      minutes_entity: !input minutes      earliest_entity: !input earliest      latest_entity: !input latest      all_prices: "{{ state_attr(prices_entity, 'prices') or [] }}"      best: >        {% set n = ((states(minutes_entity) | float(60)) / 15) | round(0, 'ceil') | int %}        {% set h0 = states(earliest_entity) | int(0) %}        {% set h1 = states(latest_entity) | int(24) %}        {% set midnight = today_at('00:00') %}        {% set nowts = now().timestamp() %}        {% set d = 0 if nowts < (midnight + timedelta(hours=h1)).timestamp() else 1 %}        {% set ws = (midnight + timedelta(days=d, hours=h0)).timestamp() %}        {% set we = (midnight + timedelta(days=d, hours=h1)).timestamp() %}        {% set cand = all_prices | selectattr('ts', 'ge', ws) | selectattr('ts', 'lt', we) | list %}        {% set ns = namespace(avg=none, s_ts=0, e_ts=0) %}        {% if n > 0 and h1 > h0 and cand | length >= n %}          {% for i in range(0, (cand | length) - n + 1) %}            {% set w = cand[i:i + n] %}            {% if w[-1].ts + 900 <= we %}              {% set avg = (w | map(attribute='p') | sum) / n %}              {% if ns.avg is none or avg < ns.avg %}                {% set ns.avg = avg %}                {% set ns.s_ts = w[0].ts %}                {% set ns.e_ts = w[-1].ts + 900 %}              {% endif %}            {% endif %}          {% endfor %}        {% endif %}        {% set now_run = all_prices | selectattr('ts', 'ge', nowts) | list %}        {% set saving = ((now_run[:n] | map(attribute='p') | sum) / n - ns.avg) | round(2)                        if ns.avg is not none and n > 0 and now_run | length >= n else none %}        {{ {'start': (ns.s_ts | timestamp_local) if ns.avg is not none else none,            'end': (ns.e_ts | timestamp_local) if ns.avg is not none else none,            'avg': (ns.avg | round(2)) if ns.avg is not none else none,            'saving': saving, 'slots': n, 'day': d,            'status': none if ns.avg is none else                      ('past' if ns.e_ts <= nowts else ('active' if ns.s_ts <= nowts else 'upcoming'))} }}
sensor:  device_class: timestamp  icon: mdi:clock-check-outline  availability: '{{ best.start is not none }}'  state: '{{ best.start }}'  attributes:    end: '{{ best.end }}'    average_price: '{{ best.avg }}'    saving: '{{ best.saving }}'    periods: '{{ best.slots }}'    day: "{{ 'today' if best.day == 0 else 'tomorrow' }}"    status: '{{ best.status }}'
The sensor’s state is the start time. Its attributes have the end time, the average price, how much you save per kWh compared with starting now, and whether the window is upcoming, active or past.
Step 3: the package
The package creates the settings, the price sensors and one cheapest window. Save it as config/packages/spot_price.yaml.
Show the package
# Spot electricity price with VAT and margin, 15-minute periods, and the cheapest time window.# Save as config/packages/spot_price.yaml (packages must be enabled in configuration.yaml).# The cheapest window at the end uses the template blueprint# blueprints/template/automate_the_north/cheapest_window.yaml; install that first.## Requires Home Assistant's built-in Nord Pool integration. The entity IDs below assume# area FI (sensor.nord_pool_fi_*); change "fi" and "FI" if you use another area.## Formula: c/kWh = Nord Pool price × (1 + VAT) + margin# Nord Pool prices exclude VAT. The margin is entered with VAT included, so it is added after.
# Settings, adjustable from the dashboard. Home Assistant remembers the values across restarts.input_number:  electricity_margin:    name: Electricity margin (incl. VAT)    min: 0    max: 5    step: 0.001    mode: box    unit_of_measurement: c/kWh    icon: mdi:cash-plus  electricity_vat:    name: Electricity VAT    min: 0    max: 30    step: 0.1    mode: box    unit_of_measurement: '%'    icon: mdi:percent  cheapest_window_minutes:    name: Cheapest window length    min: 15    max: 300    step: 15    unit_of_measurement: min    icon: mdi:timer-sand  cheapest_window_earliest:    name: Cheapest window earliest start    min: 0    max: 23    step: 1    unit_of_measurement: h    icon: mdi:clock-start  cheapest_window_latest:    name: Cheapest window latest end    min: 1    max: 24    step: 1    unit_of_measurement: h    icon: mdi:clock-end
template:  # Some unique_ids (spot_hinta_nyt etc.) come from the first version of this package.  # They are kept so that upgraded installs keep their entity IDs and history.  # Current and next price. These update as soon as the Nord Pool sensors change.  - sensor:      - name: Electricity price now        unique_id: spot_hinta_nyt        unit_of_measurement: c/kWh        state_class: measurement        icon: mdi:flash        availability: "{{ has_value('sensor.nord_pool_fi_current_price') }}"        state: >          {% set vat = states('input_number.electricity_vat') | float(0) / 100 %}          {% set margin = states('input_number.electricity_margin') | float(0) %}          {{ (states('sensor.nord_pool_fi_current_price') | float(0) * 100 * (1 + vat) + margin) | round(2) }}
      # The Energy dashboard expects EUR/kWh. A c/kWh price would make costs 100 times too high.      - name: Electricity price now EUR        unique_id: spot_hinta_nyt_eur        unit_of_measurement: EUR/kWh        state_class: measurement        icon: mdi:currency-eur        availability: "{{ has_value('sensor.nord_pool_fi_current_price') }}"        state: >          {% set vat = states('input_number.electricity_vat') | float(0) / 100 %}          {% set margin = states('input_number.electricity_margin') | float(0) %}          {{ (states('sensor.nord_pool_fi_current_price') | float(0) * (1 + vat) + margin / 100) | round(5) }}
      - name: Electricity price next        unique_id: spot_hinta_seuraava        unit_of_measurement: c/kWh        icon: mdi:flash-outline        availability: "{{ has_value('sensor.nord_pool_fi_next_price') }}"        state: >          {% set vat = states('input_number.electricity_vat') | float(0) / 100 %}          {% set margin = states('input_number.electricity_margin') | float(0) %}          {{ (states('sensor.nord_pool_fi_next_price') | float(0) * 100 * (1 + vat) + margin) | round(2) }}
      # cheap / normal / expensive compared with the average of the next 24 hours.      # The percentage is in an attribute so a dashboard can word it in any language.      - name: Electricity price level        unique_id: electricity_price_level        icon: mdi:gauge        availability: "{{ states('sensor.electricity_price_average_24h') | float(0) > 0 }}"        state: >          {% set r = states('sensor.electricity_price_now') | float(0)                     / states('sensor.electricity_price_average_24h') | float(1) %}          {{ 'cheap' if r <= 0.8 else ('normal' if r <= 1.2 else 'expensive') }}        attributes:          percent_vs_average: >            {% set r = states('sensor.electricity_price_now') | float(0)                       / states('sensor.electricity_price_average_24h') | float(1) %}            {{ ((r - 1) * 100) | round(0) | int }}
  # The full 15-minute price curve. Runs every 15 minutes, when  # Nord Pool publishes new prices, and when you change a setting.  - triggers:      - trigger: homeassistant        event: start      # Recalculate right after a template reload too, not only on the next quarter      - trigger: event        event_type: event_template_reloaded      - trigger: time_pattern        minutes: /15      - trigger: state        entity_id: sensor.nord_pool_fi_last_updated      - trigger: state        entity_id:          - input_number.electricity_margin          - input_number.electricity_vat
    actions:      - variables:          entry: "{{ config_entry_id('sensor.nord_pool_fi_current_price') }}"
      # The Nord Pool day runs on Central European time. In Finland (one hour ahead) the      # first hour of the local day is in the previous Nord Pool day, so fetch yesterday too.      # A day that isn't published yet returns an empty list, not an error.      - action: nordpool.get_prices_for_date        data:          config_entry: '{{ entry }}'          date: '{{ (now() - timedelta(days=1)).date() }}'          areas: [FI]        response_variable: r_yesterday      - action: nordpool.get_prices_for_date        data:          config_entry: '{{ entry }}'          date: '{{ now().date() }}'          areas: [FI]        response_variable: r_today      - action: nordpool.get_prices_for_date        data:          config_entry: '{{ entry }}'          date: '{{ (now() + timedelta(days=1)).date() }}'          areas: [FI]        response_variable: r_tomorrow
      - variables:          # One list from local midnight onwards: t = local ISO time, ts = epoch, p = c/kWh          all_prices: >            {% set vat = states('input_number.electricity_vat') | float(0) / 100 %}            {% set margin = states('input_number.electricity_margin') | float(0) %}            {% set cutoff = today_at('00:00').timestamp() %}            {% set raw = (r_yesterday.FI | default([])) + (r_today.FI | default([]))                       + (r_tomorrow.FI | default([])) %}            {% set ns = namespace(out=[]) %}            {% for x in raw %}              {% set st = x.start | as_datetime %}              {% if st.timestamp() >= cutoff %}                {% set ns.out = ns.out + [{                     't': (st | as_local).isoformat(),                     'ts': st.timestamp() | int,                     'p': ((x.price / 10.0) * (1 + vat) + margin) | round(3) }] %}              {% endif %}            {% endfor %}            {{ ns.out }}
    sensor:      # The price curve for charts. The state is the number of periods, so it has no unit.      - name: Electricity prices        unique_id: spot_hinnat_15min        icon: mdi:chart-bar        state: '{{ all_prices | count }}'        attributes:          prices: '{{ all_prices }}'          tomorrow_available: '{{ (r_tomorrow.FI | default([]) | count) > 0 }}'
      - name: Electricity price average 24h        unique_id: spot_keskihinta_24h        unit_of_measurement: c/kWh        icon: mdi:chart-line        availability: '{{ all_prices | count > 0 }}'        state: >          {% set t0 = now().timestamp() %}          {% set fut = all_prices | selectattr('ts', 'ge', t0) | selectattr('ts', 'le', t0 + 86400) | list %}          {{ ((fut | map(attribute='p') | sum) / (fut | length)) | round(2) if fut | length > 0 else 'unknown' }}
    binary_sensor:      # On when the current price is at or below the next 24 hours' average. For automations.      - name: Electricity cheap now        unique_id: spot_halpa_nyt        icon: mdi:thumb-up        availability: '{{ all_prices | count > 0 }}'        state: >          {% set t0 = now().timestamp() %}          {% set fut = all_prices | selectattr('ts', 'ge', t0) | selectattr('ts', 'le', t0 + 86400) | list %}          {{ fut | length > 0             and states('sensor.electricity_price_now') | float(999)                 <= (fut | map(attribute='p') | sum) / (fut | length) }}
  # The cheapest window: 60 minutes between 00 and 24 by default, adjustable from the dashboard.  # Add more windows (sauna, laundry...) by copying this block with their own input_numbers.  - use_blueprint:      path: automate_the_north/cheapest_window.yaml      input:        prices: sensor.electricity_prices        minutes: input_number.cheapest_window_minutes        earliest: input_number.cheapest_window_earliest        latest: input_number.cheapest_window_latest    name: Cheapest window    unique_id: cheapest_window
More windows. Give each thing you want to schedule its own small package file with three settings and one blueprint instance, for example config/packages/sauna_window.yaml:
input_number:  sauna_minutes:    name: Sauna window length    min: 15    max: 300    step: 15    unit_of_measurement: min  sauna_earliest:    name: Sauna earliest start    min: 0    max: 23    step: 1    unit_of_measurement: h  sauna_latest:    name: Sauna latest end    min: 1    max: 24    step: 1    unit_of_measurement: h
template:  - use_blueprint:      path: automate_the_north/cheapest_window.yaml      input:        prices: sensor.electricity_prices        minutes: input_number.sauna_minutes        earliest: input_number.sauna_earliest        latest: input_number.sauna_latest    name: Sauna cheapest window    unique_id: sauna_cheapest_window
Packages need to be enabled once in configuration.yaml. The price curve is a long list in an attribute, so keep it out of the database:
homeassistant:  packages: !include_dir_named packages
recorder:  exclude:    entities:      - sensor.electricity_prices
Changes to recorder need a restart. After that, later edits to the package only need Developer tools → YAML → Template entities and Input numbers.
Step 4: set your values once
New number helpers start at their minimum, so enter these once, either from the dashboard in step 4 or under Settings → Devices & services → Helpers:
- Margin: your retailer’s margin in c/kWh, VAT included, as stated in your contract.
- VAT: the VAT on electricity in your country, for example 25.5 % in Finland.
- Window length, earliest start and latest end: for the sauna I use 60 minutes between 18 and 21.
The price sensors update as soon as the settings change.
Step 5: the dashboard
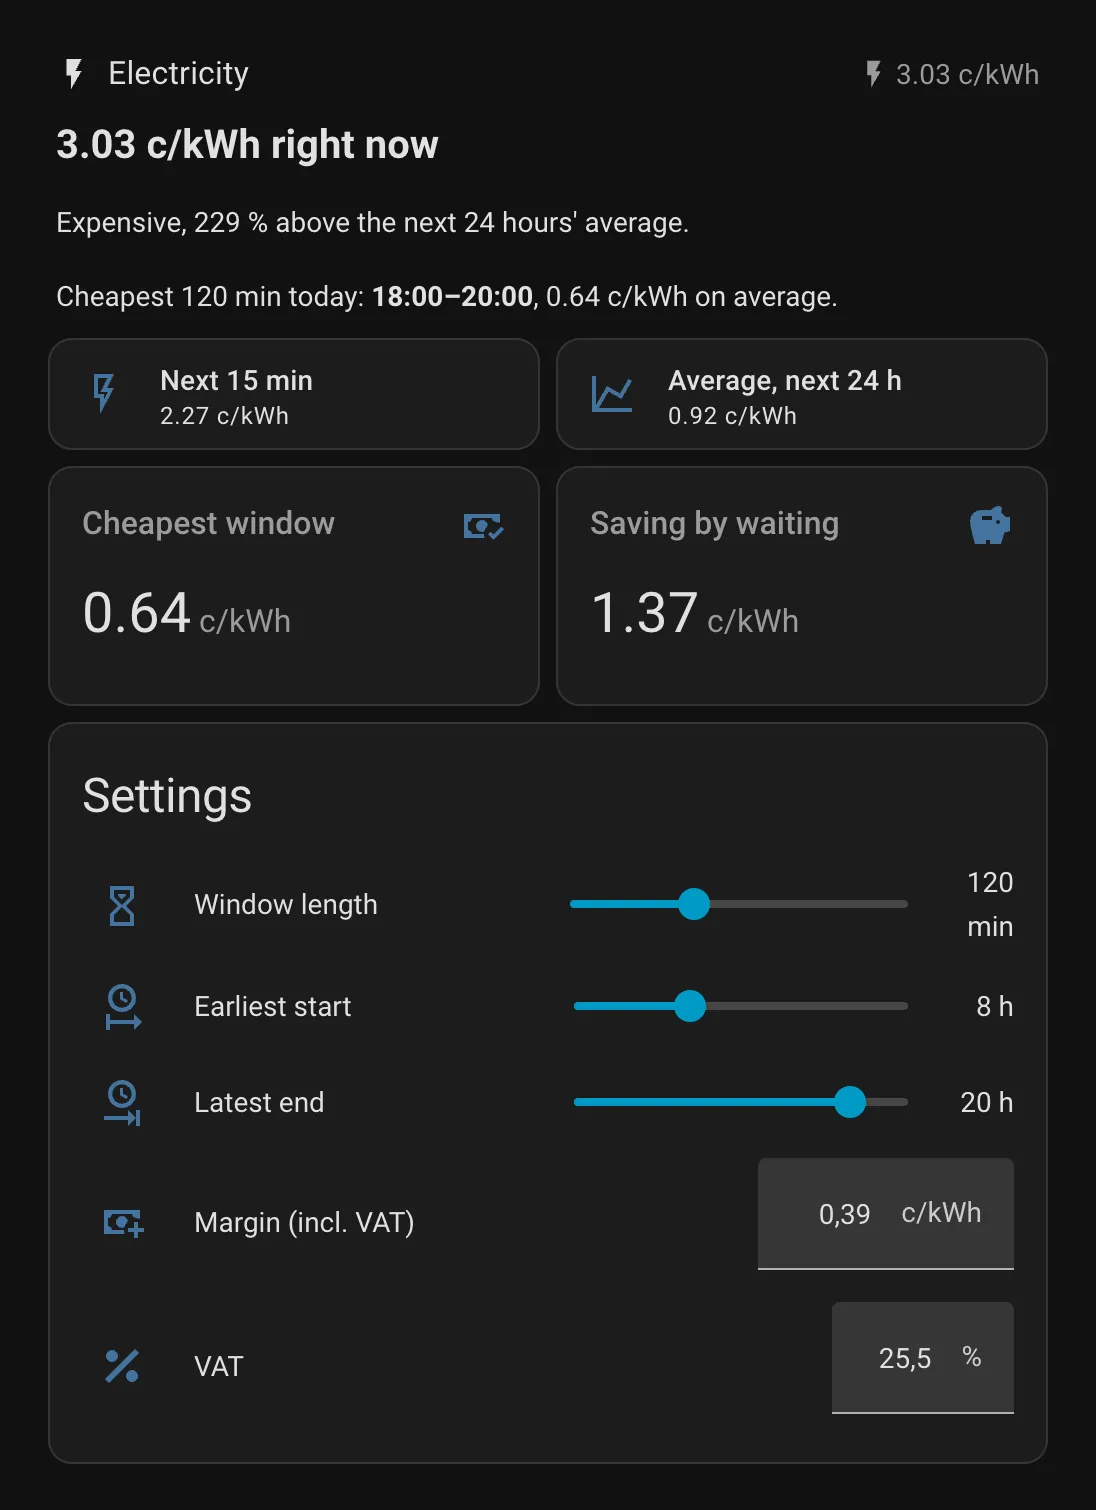
The section uses only built-in cards. The top lines say in plain words what’s going on, for example “Expensive, 62 % above the next 24 hours’ average” and “Cheapest 60 min today: 20:00–21:00, 0.60 c/kWh on average”. The settings from step 3 are at the bottom. In a Sections view, add a section, open Edit in YAML and paste:
Show the dashboard YAML
# Dashboard section for electricity prices. In a Sections view: add section → ⋮ → Edit in YAML, paste this.type: gridcards:  - type: heading    heading: Electricity    heading_style: title    icon: mdi:flash    badges:      - type: entity        entity: sensor.electricity_price_now        show_icon: true        show_state: true  - type: markdown    text_only: true    grid_options:      columns: full    content: |-      {%- set p = states('sensor.electricity_price_now') | float(none) -%}      {%- set lvl = states('sensor.electricity_price_level') -%}      {%- set pct = state_attr('sensor.electricity_price_level', 'percent_vs_average') | int(0) -%}      {%- set w = 'sensor.cheapest_window' -%}      ## {{ '%.2f' | format(p) if p is not none else '–' }} c/kWh right now      {% if lvl in ['cheap', 'normal', 'expensive'] -%}      {{ {'cheap': 'Cheap', 'normal': 'Normal', 'expensive': 'Expensive'}[lvl] }},      {%- if pct == 0 %} the same as the next 24 hours' average.      {%- else %} {{ pct | abs }} % {{ 'above' if pct > 0 else 'below' }} the next 24 hours' average.{% endif %}      {%- endif %}
      {% if has_value(w) -%}      {%- set a = states(w) | as_datetime | as_local -%}      {%- set b = state_attr(w, 'end') | as_datetime | as_local -%}      {%- set st = state_attr(w, 'status') -%}      Cheapest {{ (state_attr(w, 'periods') | int(0)) * 15 }} min {{ state_attr(w, 'day') }}: **{{ a.strftime('%H:%M') }}–{{ b.strftime('%H:%M') }}**, {{ '%.2f' | format(state_attr(w, 'average_price') | float(0)) }} c/kWh on average      {%- if st == 'active' %} (now){% elif st == 'past' %} (already passed){% endif %}.      {%- else -%}      No price data for the window yet.      {%- endif %}  - type: tile    entity: sensor.electricity_price_next    name: Next 15 min    icon: mdi:flash-outline    vertical: false    grid_options:      columns: 6  - type: tile    entity: sensor.electricity_price_average_24h    name: Average, next 24 h    icon: mdi:chart-line    vertical: false    grid_options:      columns: 6  - type: entity    entity: sensor.cheapest_window    attribute: average_price    unit: c/kWh    name: Cheapest window    icon: mdi:cash-check    grid_options:      columns: 6  - type: entity    entity: sensor.cheapest_window    attribute: saving    unit: c/kWh    name: Saving by waiting    icon: mdi:piggy-bank    grid_options:      columns: 6  - type: entities    title: Settings    state_color: false    grid_options:      columns: full    entities:      - entity: input_number.cheapest_window_minutes        name: Window length      - entity: input_number.cheapest_window_earliest        name: Earliest start      - entity: input_number.cheapest_window_latest        name: Latest end      - entity: input_number.electricity_margin        name: Margin (incl. VAT)      - entity: input_number.electricity_vat        name: VAT
Home Assistant’s built-in charts only show history, not tomorrow’s prices. For a price chart with the cheapest window highlighted you need apexcharts-card from HACS:
Show the chart YAML (HACS)
# Optional price chart. Needs apexcharts-card from HACS. Add it to the section as a card (Edit in YAML).type: custom:apexcharts-cardheader: show: true title: Spot price today (c/kWh incl. VAT and margin)graph_span: 24hspan: start: daynow: show: true label: nowyaxis: - min: ~0 decimals: 2series: # The whole day's 15-minute prices from the attribute of sensor.electricity_prices - entity: sensor.electricity_prices name: Spot price type: column color: '#5c9ece' unit: ' c/kWh' float_precision: 2 data_generator: | const d0 = new Date(); d0.setHours(0, 0, 0, 0); const s = d0.getTime(), e = s + 86400000; return entity.attributes.prices .filter((p) => p.ts * 1000 >= s && p.ts * 1000 < e) .map((p) => [p.ts * 1000, p.p]); # The same bars highlighted for the cheapest window - entity: sensor.electricity_prices name: Cheapest window type: column color: '#57bb8a' unit: ' c/kWh' float_precision: 2 data_generator: | const d0 = new Date(); d0.setHours(0, 0, 0, 0); const s = d0.getTime(), e = s + 86400000; const w = hass.states['sensor.cheapest_window']; const ws = w && w.attributes.end ? new Date(w.state).getTime() : 0; const we = w && w.attributes.end ? new Date(w.attributes.end).getTime() : 0; return entity.attributes.prices .filter((p) => p.ts * 1000 >= s && p.ts * 1000 < e) .map((p) => [p.ts * 1000, p.ts * 1000 >= ws && p.ts * 1000 < we ? p.p : null]);Step 6: consumption from the meter’s HAN port
Prices tell you when electricity is cheap. To see what you actually spend, Home Assistant also needs your consumption. Smart meters in Finland have a HAN port for this: a local data port on the meter that reports energy and power in real time, without going through the network company’s online service.
I use a HomeWizard P1 Meter plugged into the HAN port. It takes its power from the port, connects to Wi-Fi and has a local API, so Home Assistant’s built-in HomeWizard integration reads it directly: imported energy, total power, and power, voltage and current for each phase.
- Check that the HAN port is open. On some meters the network company has to open it first; their website tells you how to ask.
- Plug in the P1 Meter, connect it to Wi-Fi with the HomeWizard Energy app, and turn on Local API for the meter in the app’s settings.
- Home Assistant discovers it under Settings → Devices & services. Add it there.
Step 7: costs in the Energy dashboard
In Settings → Dashboards → Energy, add grid consumption and pick the P1 Meter’s imported energy sensor. Then choose Use an entity with current price and select sensor.electricity_price_now_eur. Use the EUR/kWh sensor, not the c/kWh one, or the costs come out a hundred times too high. You can also add the meter’s power sensor as grid power to see the current draw in the Energy dashboard.
Good to know
- Why Finland needs yesterday’s prices. The Nord Pool day runs on Central European time, which is an hour behind Finland, so the first hour of the Finnish day is in the previous Nord Pool day. The package fetches yesterday, today and tomorrow and keeps everything from local midnight onwards.
- Tomorrow’s prices arrive in the afternoon. Until then the window and the 24-hour average only cover the prices known so far.
- The window doesn’t disappear once it has passed. It keeps showing today’s best moment, marked as passed, until the time range ends. That way you can see it in the morning and plan around it.
- The margin is added after VAT because contracts usually state it with VAT included. If yours doesn’t, enter it multiplied by your VAT factor.
- For automations use
binary_sensor.electricity_cheap_now, which is on when the price is at or below the next 24 hours’ average, or the start and end attributes ofsensor.cheapest_window.